top of page

Creating advanced data applications and visualizations that users love


ChartFactor June 2021 Release
The June 2021 release of the ChartFactor Visual Analytics Platform is now available, packed with customer-driven improvements and amazing...

Aktiun Engineering
Jun 30, 20211 min read


ChartFactor April 2021 Release
The ChartFactor team is proud to present the April 2021 release of the ChartFactor Visual Analytics Platform, the most powerful solution...
Aktiun Engineering
Apr 29, 20211 min read


ChartFactor September 2020 Release
The Aktiun team is proud to present the September 2020 release of the ChartFactor Visual Analytics Platform. It increases its lead as the...
Aktiun Engineering
Sep 28, 20201 min read
Video tutorial: Embedding
Our Embedding video tutorial shows you how to embed ChartFactor Studio visualizations into your custom application with easy copy/pasting...
Aktiun Engineering
Jun 2, 20201 min read


China - Air pollution 2015
Replay data month by month and visualize main pollutants and air pollution levels across China's main cities.
Aktiun Engineering
May 26, 20201 min read

Video tutorial: Adding calculations
Our third ChartFactor Studio video tutorial: Adding calculations! It walks you through adding derived metrics, custom labels, and additional
Aktiun Engineering
May 19, 20201 min read


ChartFactor May 2020 Release
The May 2020 release of the ChartFactor Visual Analytics Platform is now available, adding powerful customer-driven features and...
Aktiun Engineering
May 12, 20201 min read
Video Tutorial: Adding Interactivity
In this class you will learn how to add elements of interactivity to your dashboard using ChartFactor Studio Community Edition. #ChartFactor
Aktiun Engineering
May 7, 20201 min read


Video Tutorial: ChartFactor Studio Introduction
Our first video tutorial: ChartFactor Studio introduction! Click here to go to the class materials. Additional videos to come soon to...
Aktiun Engineering
Apr 29, 20201 min read


ChartFactor April 2020 Release
The April 2020 release of ChartFactor, the lightweight visual analytics platform, is now available, bringing more value to your visual...
Aktiun Engineering
Apr 7, 20201 min read
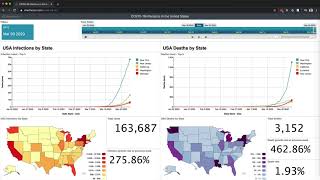
COVID-19 infections in the United States interactive dashboard
We are making our "COVID-19 infections in the United States" dashboard publicly available at https://chartfactor.com/covid-19-us/. Here...
Aktiun Engineering
Mar 31, 20201 min read


ChartFactor February 2020 Release
The February 2020 release of the ChartFactor Visual Analytics Platform is now available, packed with customer-driven improvements and...
Aktiun Engineering
Feb 5, 20201 min read


ChartFactor December 2019 Release
The December 2019 release of the ChartFactor Visual Analytics Platform is now available, increasing ChartFactor's lead as the best visual...
Aktiun Engineering
Dec 11, 20191 min read


ChartFactor October 2019 Release
The October 2019 release of ChartFactor, the Lightweight Visual Analytics Platform, is now available, bringing more value to your visual...
Aktiun Engineering
Oct 16, 20191 min read
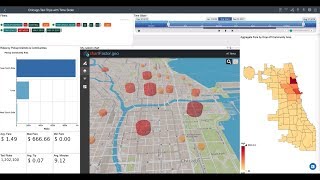
Exploring 3D geo data on the full Chicago Taxi Trips dataset
This video shows ChartFactor's lightweight and embeddable visual analytics components exploring 3D geo data on the full Chicago Taxi...

Jorge Alarcon
Oct 9, 20191 min read


ChartFactor 1.13 Released
The August 2019 release of ChartFactor is now available! This new release keeps extending ChartFactor's lead as the best solution to...
Aktiun Engineering
Aug 14, 20191 min read


Lightweight and Embeddable: the new way to do streaming visual analytics
Several data architectures exist to process and store high volumes of streaming data, human or machine generated. However, when it's...
Jorge Alarcon
Jul 9, 20192 min read


How to instantly create advanced data applications with the Studio CLI
At Aktiun, we recently introduced the Studio CLI to save you time when creating advanced data applications. It translates Studio...
Jorge Alarcon
Jun 19, 20191 min read

Embedded visual analytics: a transparent code approach
While some BI tools support embedded visual analytics with different degrees of functionality, the details and learning curve to create...
Jorge Alarcon
Jun 12, 20192 min read


ChartFactor 1.12 Released
The June 2019 release of ChartFactor is now available! ChartFactor, the leading solution to bring visual analytics to your data products,...
Aktiun Engineering
Jun 6, 20192 min read
bottom of page