top of page

Creating advanced data applications and visualizations that users love


Reshape Data, Discover Patterns
Large datasets shouldn't mean rigid analysis. ChartFactor Studio's Pivot Table V2 is designed to give users more freedom to explore massive datasets, currently with support for Google BigQuery. Rather than locking users into a predefined view, Pivot Table V2 makes it possible to reshape analysis through drag-and-drop interactions, moving between dimensions and perspectives as questions change. Custom null handling, themes, and one-click full-screen viewing add further flexibi

Aktiun Engineering
Sep 21 min read


Layered Data, Deeper Context
One layer gives you a view. Multiple layers give you context. ChartFactor’s Interactive Multi-Layer Geo Maps allow teams to bring geographic information together from different data sources and data engines within the same analytical experience. Instead of treating each dataset as a separate view, multiple layers can be explored together, making it easier to identify relationships, compare patterns, and add context to what is happening in a particular location. This flexibili
Aktiun Engineering
Aug 261 min read


Reshape Data, Find Insight
As data grows, the ability to explore it flexibly becomes just as important as the data itself. ChartFactor Studio's Pivot Table V2 is designed to support that kind of exploration. Built for massive datasets (currently for Google BigQuery), it allows users to move seamlessly between dimensions through intuitive drag-and-drop interactions while maintaining strong performance at scale. Features such as custom handling of null values, visual themes, and one-click full-screen mod
Aktiun Engineering
Jul 291 min read


Market Insight Made Visual
Some of the most useful analytics applications are the ones that help people make sense of decisions they face every day. ChartFactor's Residential Real Estate application was built with exactly that in mind. Using monthly inventory statistics from Realtor.com, users can compare ZIP codes across the United States, explore trends in active listings and median listing prices, and quickly navigate to Realtor.com for additional context on a selected state or ZIP code. The applica
Aktiun Engineering
Jul 221 min read


From Overview To Detail
Good analytics should help users move naturally from overview to detail without forcing them to change tools or workflows. That principle is one of the reasons interactive multi-layer geo maps are becoming increasingly important in modern data products. By combining information from multiple data sources and data engines within a single geographic view, users can explore relationships that would otherwise remain hidden across separate dashboards and reports. ChartFactor Geo m
Aktiun Engineering
Jul 11 min read


Reshape and Explore
As datasets grow larger, the challenge is no longer collecting information, it's making exploration feel effortless. ChartFactor Studio's Pivot Table V2 was built to support that goal. Designed for large-scale datasets, it allows users to reshape and explore information through intuitive drag-and-drop interactions, helping analysts move quickly between questions without losing context. Features such as custom handling of null values, visual themes, and one-click full-screen v
Aktiun Engineering
Jun 241 min read


Flexible Data, Deeper Insight
As data products evolve, expectations move beyond simple dashboards toward deeper, more flexible analysis. ChartFactor supports this shift through capabilities designed for both scale and usability. Pivot Table V2 allows teams to work with large datasets while maintaining interactivity, supporting flexible exploration, more advanced data manipulation, and a more fluid way of moving between different levels of detail within the same dataset. At the same time, multi-layer geo m
Aktiun Engineering
May 131 min read


Explore With Confidence
Speed in analytics isn’t just about performance - it’s about how quickly users can move from a question to a meaningful answer. ChartFactor Studio continues to refine that experience by making interaction more direct and flexible. Users can filter data intuitively and explore results without unnecessary steps, allowing analysis to flow more naturally from one insight to the next. Studio also supports custom queries, giving teams greater control over how logic is defined and r
Aktiun Engineering
Apr 291 min read
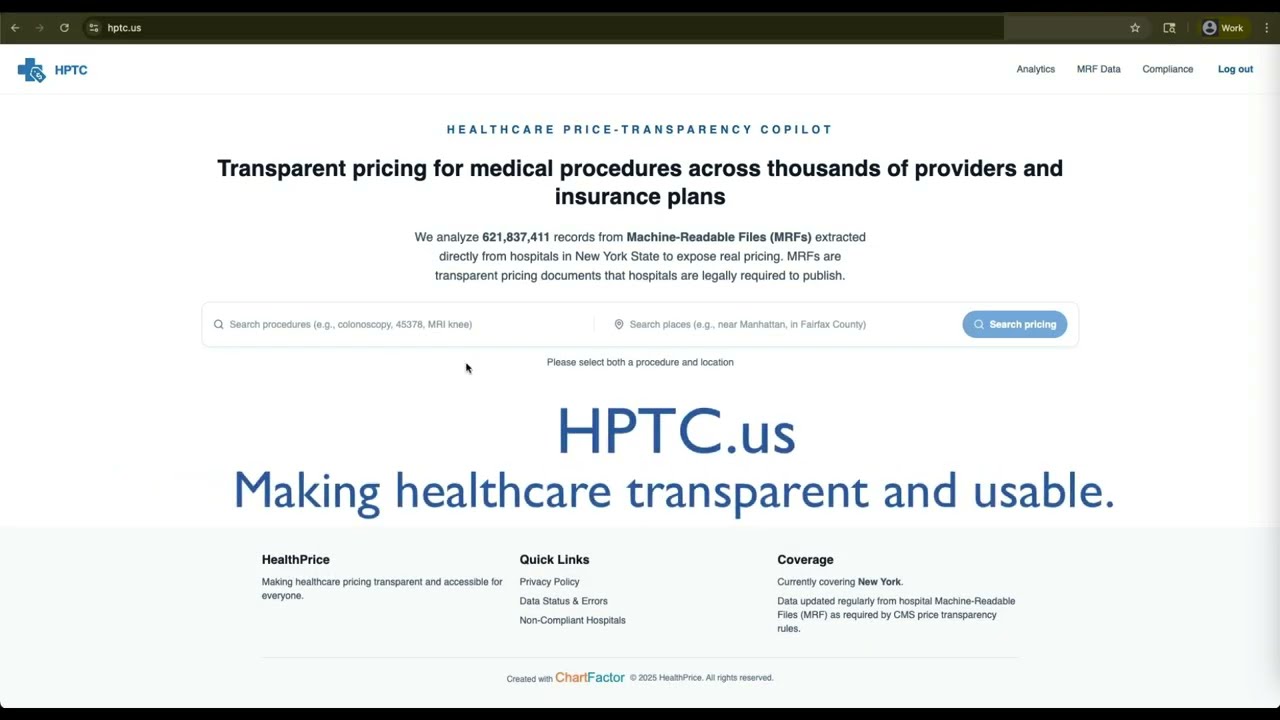
Introducing HPTC - Turning Hospital Price Transparency into Usable Intelligence
Hospital pricing is public. But until now, it hasn’t been usable. Today, we’re proud to present HPTC (Health Price Transparency Companion) - an application designed to make hospital MRF (Machine Readable File) data accessible, searchable, and actionable. Every hospital in the U.S. publishes massive pricing files in JSON and CSV formats. While technically transparent, these files are often complex, inconsistent, and difficult to analyze without specialized tools. That’s where
Aktiun Engineering
Feb 251 min read


Scaling Without the Noise
“Good design is as little design as possible.” - Dieter Rams The best analytics systems don’t draw attention to themselves. They simply work; adapting as products grow, data scales, and user needs change. ChartFactor is built around that principle. Its architecture avoids unnecessary layers, keeps execution close to the browser, and exposes behaviour clearly to developers. The goal isn’t to abstract everything away, it’s to keep analytics understandable, adaptable, and durabl
Aktiun Engineering
Feb 181 min read


Spatial Clarity, Granular Detail
Geographic data only creates value when users can interact with it fluidly - without waiting for queries or wrestling with overloaded maps. ChartFactor’s geo capabilities are built to support just that kind of experience from day one. Interactive maps render client-side, keeping zooming, filtering, and exploration responsive even under heavy use. As users move through different levels of detail, precision adjusts naturally through techniques like geohash clustering; revealing
Aktiun Engineering
Feb 41 min read


Visual Analytics Without Friction
When teams build data products, the analytics layer can quietly become a drag on progress; introducing friction between design, engineering, and infrastructure instead of enabling momentum. ChartFactor Studio is designed to remove that friction. It gives teams a browser-based environment for building interactive dashboards and analytics components without adding weight to the backend. Developers maintain full visibility and control over how charts, filters, and interactions w
Aktiun Engineering
Jan 281 min read


Building Analytics That Evolve With Your Product
“It’s not the strongest of the species that survives…but the one most responsive to change.” - Charles Darwin In data products, adaptability matters more than almost anything else. Datasets grow. User expectations shift. What worked at launch often struggles under real-world scale and pressure. ChartFactor is designed with that reality in mind. Its browser-native execution model, modular components, and transparent architecture allow teams to evolve analytics alongside the pr
Aktiun Engineering
Jan 211 min read


User-Driven Evolution
Analytics should feel like a core part of your product, not a separate system which users have to tolerate. That’s why ChartFactor’s Toolkit is designed to help teams build analytics that feel native, responsive, and reliable - especially as data volumes grow. Recent Toolkit updates reflect strong user feedback around real-world usage. Scrolling performance for very large tables has been improved with a configurable “slow scroll” mode, helping prevent accidental jumps when wo
Aktiun Engineering
Jan 141 min read


Rich, Scalable Geo-Exploration
Location data only becomes valuable when it’s easy to explore and when performance holds up as scale grows. ChartFactor’s geo capabilities are designed around that reality; providing users with responsive maps, smooth interaction, and infrastructure that doesn’t get in the way. ChartFactor’s Geo Map GL module supports rich spatial visualisation, including markers, shapes, proportional symbols, heatmaps, and zoom-based precision through geohash clustering. As users move throug
Aktiun Engineering
Jan 71 min read


Turn Complexity Into Momentum
For SaaS teams building data products, analytics can either accelerate your roadmap - or slow everything down. ChartFactor is built so that analytics becomes a catalyst rather than a constraint. You get modular components that embed natively in your UI, browser-based execution that cuts down on backend dependencies, and full code transparency so teams can extend or customize without vendor lock-in. It’s a development model that supports rapid iteration whilst preserving long-
Aktiun Engineering
Dec 10, 20251 min read


See Clearly, Act with Confidence
Some product decisions only become obvious when you understand where the data is actually happening. ChartFactor’s geo capabilities are built to make that spatial context fast, intuitive, and seamless to embed directly into your product. The Geo Map GL module supports a wide range of geographic visualizations-markers, shapes, proportional circles, heat-maps, and dynamic precision through geohash clustering as users zoom in and out. Everything renders client-side, staying resp
Aktiun Engineering
Dec 5, 20251 min read


Interactive Intelligence On Demand
When teams build data products, the analytics layer can often become a bottleneck - too many moving parts, too much overhead, and too much friction between design, engineering, and infrastructure. ChartFactor Studio reverses that dynamic. It gives teams a browser-based environment for building interactive dashboards and analytics components without adding weight to the backend. Developers maintain full visibility and control over how charts, filters, and interactions work, wi
Aktiun Engineering
Nov 26, 20251 min read


Building Analytics That Grow With Your Product
“Patience and foresight are the two most important qualities in business.” — Henry Ford Launching a SaaS product is only the start. What matters more in the long run is whether your analytics keep pace - with your users, your data growth, and your evolving product demands. ChartFactor is the perfect visual analytics solution to support you on that journey. You get browser-native performance, modular embedding of charts and dashboards, full developer visibility through code t
Aktiun Engineering
Oct 22, 20251 min read

BigQuery-Native Pivot for Massive SaaS Analytics
A powerful new version of the ChartFactor Pivot Table is here, currently supported for Google BigQuery. If you build visual analytics...
Aktiun Engineering
Aug 27, 20251 min read
bottom of page