top of page

Creating advanced data applications and visualizations that users love


Flexible Data, Deeper Insight
As data products evolve, expectations move beyond simple dashboards toward deeper, more flexible analysis. ChartFactor supports this shift through capabilities designed for both scale and usability. Pivot Table V2 allows teams to work with large datasets while maintaining interactivity, supporting flexible exploration, more advanced data manipulation, and a more fluid way of moving between different levels of detail within the same dataset. At the same time, multi-layer geo m

Aktiun Engineering
May 131 min read


Beyond Data: Building Systems That Reveal What Matters
“The greatest value of a picture is when it forces us to notice what we never expected to see.” - John Tukey In modern analytics, the real challenge isn’t collecting data - it’s shaping it into something people can actually use. ChartFactor Studio and ChartFactor Geo are built around this principle, focusing on practical interaction, responsive exploration, and scalable performance so teams can move naturally from raw data to meaningful understanding. Improvements to data ex
Aktiun Engineering
Apr 221 min read


Smooth Connection, Rapid Discovery
Strong analytics platforms remove friction long before insights are delivered. ChartFactor Studio continues to streamline how users connect to and explore their data, with optimized Text Search delivering faster and more responsive results across large datasets. Whether narrowing down records or refining queries step by step, search now feels more immediate, helping users move from question to answer with less effort. Studio also improves authentication and connection workflo
Aktiun Engineering
Apr 81 min read


Fast Exploration, Clear Insight
When working with live data, even small improvements in interaction can significantly accelerate the path to insight. ChartFactor Studio’s latest Raw Data Table enhancements are designed to make exploration more direct and intuitive. Users can now filter directly from selected cells, turning a simple interaction into an immediate analytical step and reducing the time spent navigating menus or building manual filters. Copy-and-paste support also makes it easier to extract and
Aktiun Engineering
Apr 11 min read


Why Small Improvements Drive Great Analytics Platforms
“Excellence is a habit.” - Will Durrant In analytics platforms, excellence rarely comes from one dramatic release. It comes from steady refinement - improving how people filter, search, connect, and explore data every day. Recent updates in ChartFactor Studio reflect that mindset. Filtering directly from selected cells makes exploration faster and more intuitive. Copy-and-paste support simplifies collaboration and validation. Search responsiveness has been enhanced for large
Aktiun Engineering
Mar 251 min read


Scaling Without the Noise
“Good design is as little design as possible.” - Dieter Rams The best analytics systems don’t draw attention to themselves. They simply work; adapting as products grow, data scales, and user needs change. ChartFactor is built around that principle. Its architecture avoids unnecessary layers, keeps execution close to the browser, and exposes behaviour clearly to developers. The goal isn’t to abstract everything away, it’s to keep analytics understandable, adaptable, and durabl
Aktiun Engineering
Feb 181 min read


Modular Scalable Analytics
When analytics are bolted onto a product, they tend to age badly. Updates become risky, performance tuning turns painful and customisation can feel constrained. ChartFactor takes a different approach. Its modular components embed directly into your product UI, with browser-based execution and full code transparency. Teams retain control over behaviour, interaction, and performance, without taking on any unnecessary backend complexity. Recent Toolkit updates reinforce this pro
Aktiun Engineering
Feb 111 min read


Spatial Clarity, Granular Detail
Geographic data only creates value when users can interact with it fluidly - without waiting for queries or wrestling with overloaded maps. ChartFactor’s geo capabilities are built to support just that kind of experience from day one. Interactive maps render client-side, keeping zooming, filtering, and exploration responsive even under heavy use. As users move through different levels of detail, precision adjusts naturally through techniques like geohash clustering; revealing
Aktiun Engineering
Feb 41 min read


Building Analytics That Evolve With Your Product
“It’s not the strongest of the species that survives…but the one most responsive to change.” - Charles Darwin In data products, adaptability matters more than almost anything else. Datasets grow. User expectations shift. What worked at launch often struggles under real-world scale and pressure. ChartFactor is designed with that reality in mind. Its browser-native execution model, modular components, and transparent architecture allow teams to evolve analytics alongside the pr
Aktiun Engineering
Jan 211 min read


User-Driven Evolution
Analytics should feel like a core part of your product, not a separate system which users have to tolerate. That’s why ChartFactor’s Toolkit is designed to help teams build analytics that feel native, responsive, and reliable - especially as data volumes grow. Recent Toolkit updates reflect strong user feedback around real-world usage. Scrolling performance for very large tables has been improved with a configurable “slow scroll” mode, helping prevent accidental jumps when wo
Aktiun Engineering
Jan 141 min read


Design Is How It Works: Evolving Analytics for Modern SaaS Teams
“Design is not just what it looks like and feels like. Design is how it works.” - Steve Jobs Launching a SaaS product is only the beginning. What matters is that your analytics evolve with your users, your data growth, and your product roadmap. ChartFactor is built with that principle at its heart - offering browser-native performance, modular embedding, full developer visibility through code transparency, and advanced interactive features like filtering, drill-downs, and ge
Aktiun Engineering
Nov 19, 20251 min read


Visual Analytics You Control
For data-centric SaaS startups or product teams, visual analytics has become an essential requirement. But embedding dashboards, managing BI servers, and buying expensive analytics platforms can drain your finances and slow your pace. ChartFactor offers a smarter path. You get a modular, embeddable analytics layer with interactive features-filters, drill-downs, geo-visuals-built to scale from the first user to thousands, and from gigabytes of data to petabytes. Early-stage
Aktiun Engineering
Nov 12, 20251 min read

BigQuery-Native Pivot for Massive SaaS Analytics
A powerful new version of the ChartFactor Pivot Table is here, currently supported for Google BigQuery. If you build visual analytics...
Aktiun Engineering
Aug 27, 20251 min read
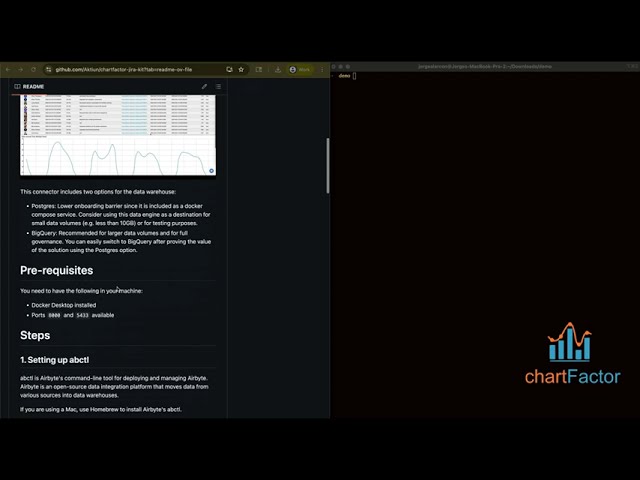
ChartFactor Jira Connector Kit
Want to see how your team is spending their time without paying for extra plugins? If your team logs work in Jira and you use ChartFactor...
Aktiun Engineering
Jul 30, 20251 min read
bottom of page