
Shift your data perspective
- Aktiun Engineering

- Apr 16, 2025
- 1 min read
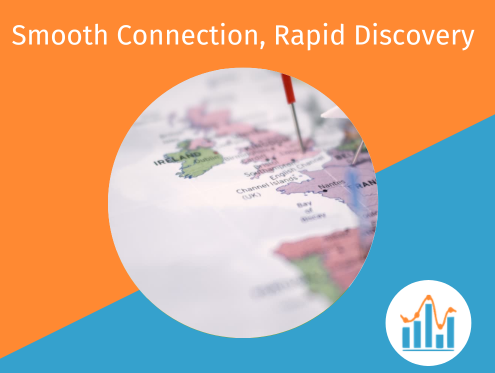
Understanding your data means looking at it from every relevant angle, including geographical.
ChartFactor’s advanced Geo Visualization capabilities allow you to explore your location-based data with powerful tools designed to uncover deeper insights and empower you to make smarter decisions.
Whether you're analyzing regional sales, customer behavior, or geographical trends, you can create dynamic, interactive visualizations that reflect the true impact of your data by making use of features such as:
Multi-layered maps with shapes, markers, heatmaps, and circles
Distant and shape filtering for more precise geographic analysis
Geo-hash queries that adjust based on zoom levels for greater precision
Flexible styling and custom configurations for tailored visualizations
ChartFactor empowers you to view your data geographically, helping you act on location-based insights so you can optimize operations, track performance or predict trends with clarity and ease.


Comments