top of page

Creating advanced data applications and visualizations that users love


To Build or Not to Build?
When it comes to selecting a Business Intelligence (BI) solution for your data product’s needs, ‘Buy or Build?’ is often the first...

Aktiun Engineering
Jan 18, 20232 min read


A fresh take on data visualization
Do you find yourself frustrated that you can’t easily present your product’s data to your users in a way that is attractive, persuasive...
Aktiun Engineering
Jan 11, 20231 min read


ChartFactor January 2023 Release
The January 2023 release of the ChartFactor Visual Analytics Platform is now available, bringing more customer-driven features and...
Aktiun Engineering
Jan 4, 20231 min read


Extensible, scalable, lightweight
No matter what business you're in, data is a critical part of understanding what's happening and making decisions. But turning data into...
Aktiun Engineering
Dec 28, 20221 min read


Making the complex simple
Have you ever struggled to make decisions even when you have access to large quantities of data? In fact, at a certain point, the volume...
Aktiun Engineering
Dec 21, 20221 min read


Data enhancing intuition
“Data is a tool for enhancing intuition” - Hilary Mason. You bring the questions based on your knowledge of your field and your feel for...
Aktiun Engineering
Dec 14, 20221 min read


Make your data stand out
Data professionals know that data can be hard to understand and not very engaging unless properly presented. Effective presentation...
Aktiun Engineering
Dec 7, 20221 min read


Exploring global data trends
In our highly complex and interconnected world, the events that confront us can sometimes feel totally overwhelming. How can individuals...
Aktiun Engineering
Nov 23, 20221 min read


Data insights
“We are surrounded by data, but starved for insights” - Jay Baer Our ChartFactor software can help to turn your raw data into actionable...
Aktiun Engineering
Nov 16, 20221 min read


Dynamic Data
When we are exploring complex and multi-faceted data, there is no one-size-fits all solution. Every use-case is different and - crucially...
Aktiun Engineering
Nov 1, 20221 min read


Where will the data lead you?
Nowadays, most people understand the importance of data in helping us to understand the world around us. But one of the biggest...
Aktiun Engineering
Oct 25, 20221 min read


ChartFactor - Analysing data across time
One of the issues we encounter, when exploring data, is knowing which timeframe is going to be most appropriate for our needs. Making use...
Aktiun Engineering
Oct 18, 20221 min read
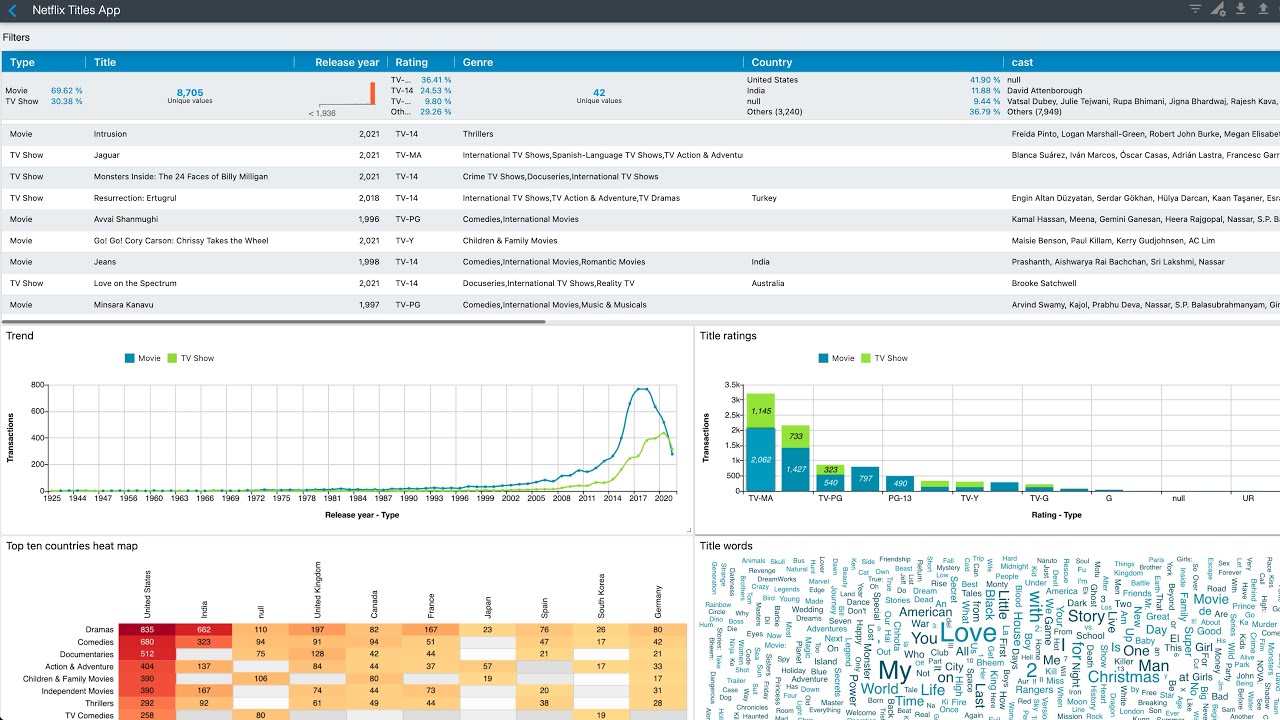
Visualizing the Netflix Titles dataset
In this video, we use ChartFactor and the Netflix Movies and TV Shows dataset provided by Shivam Bansal in Kaggle to create an...
Aktiun Engineering
Oct 11, 20221 min read


ChartFactor - Let us build it for you
There is no doubt that many are feeling the squeeze. In many large and medium-sized organisations, budgets need to be far more...
Aktiun Engineering
Oct 4, 20221 min read


ChartFactor - Presentation matters
When it comes to data, presentation matters. Effective presentation allows people to truly engage with data and helps to capture their...
Aktiun Engineering
Sep 30, 20221 min read


ChartFactor September 2022 Release
We are proud to present the September 2022 release of the ChartFactor Visual Analytics platform, the most powerful solution for embedded...
Aktiun Engineering
Sep 19, 20222 min read

ChartFactor Py - Colors and Interactivity
This video shows how to create a beautiful interactive data application using a Data Breaches 2004-2017 dataset found in Kaggle. The...
Aktiun Engineering
Jun 28, 20221 min read


ChartFactor June 2022 Release
The June 2022 release of the ChartFactor Visual Analytics Platform is now available, focusing on simplicity and effortlessness for...
Aktiun Engineering
Jun 22, 20222 min read

ChartFactor Py on Kaggle
This video shows you how to explore your Pandas DataFrames in Kaggle using ChartFactor Py. We read the Healthy Lifestyle Cities 2021...
Aktiun Engineering
Apr 11, 20221 min read

Aktiun Announces ChartFactor Py - Interactive Visual Analytics For Pandas DataFrames
Powerful visualizations and instant filtering give JupyterLab, Jupyter Notebook, and Kaggle users improved productivity when working with...

Aktiun
Mar 16, 20222 min read
bottom of page